ECONOMIC IMPACTS
THE FRENCH ECONOMIC IMPACTS
Main characteristics:
- 9th economy by purchasing power parity.
- 6th exporter economy and 4th importer of manufactured goods.
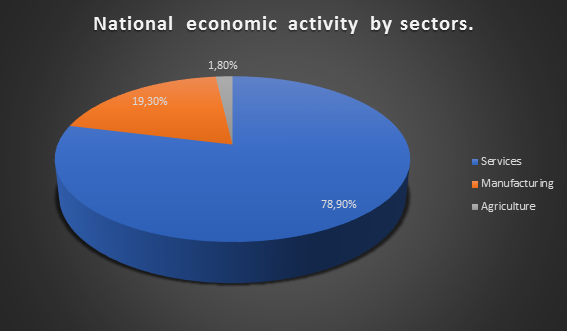
- Mixed economy: vast private sector plus strong government intervention.
- Government intervention is strong as we can see its expenditure represents 53% of GDP, which is used for family welfare support (900€ of "Baby bonus", healthcare system (Social Security), pensions, unemployment benefits and in the regulation of labor conditions.
- Chronic public deficit (3.16%±0.67 for 2003-07) which led to high public debt (67.5% of GDP in 2008).
- Due to the industrialization in the 80s in which mining, steel, textile firms had to close, creating a chronic structural unempleyment rate.
Domestic demand and private invested mostly contributed to the economic growth due in 2008 of 0,2% (1.92%±0.55 for 2003-07) but when the crisis started this dropped to -2,9 in 2009. But the following two years it seen that it was recovering, however it dropped again in 2012 to 0,2%, since then it had been increasing in a slow rate.
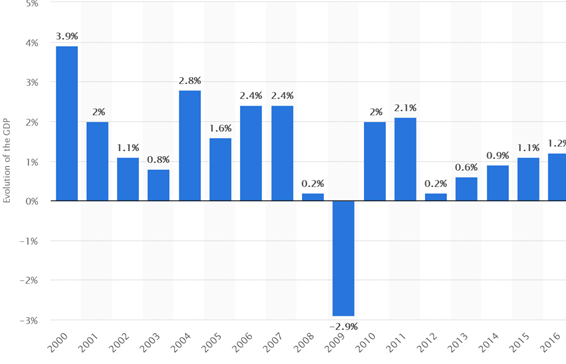
Figure 1Real GDP growth rate (2000-2016).OECD.
Real GDP growth rate: Gross domestic product (GDP) at market prices is the expenditure on final goods and services minus imports. GDP data are measured in million US dollars at current prices.
An appreciation of the euro due to a loss of competitiveness led to a worsen of the trade balance and increase in deficit.
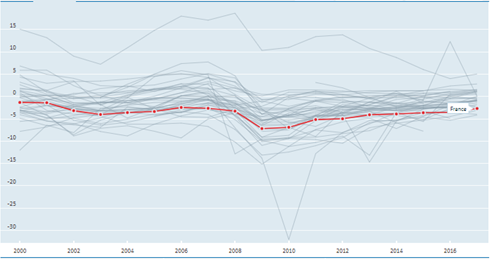
Figure 2General Government Déficit
General government deficit: fiscal position of government after accounting for capital expenditures.
Up to 2008 Government deficit had fluctuated at a regular rate but since 2008 it has increased been between 5-10%. In 2010 it seemed like it was decreasing. It has been decreasing in a slow rate but it hadn´t reached the lower levels before the crisis.
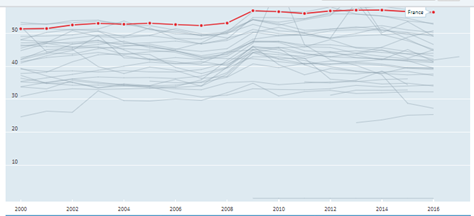
Figure 3.General Government Spending( Total % of GDP)
General government spending: generally consists of central, state and local governments, and social security funds. This indicator is measured in terms of thousand USD per capita and as a percentage of GDP.
The general government spending had a huge increase between 2008-2009, since them it had maintained constant over 50.
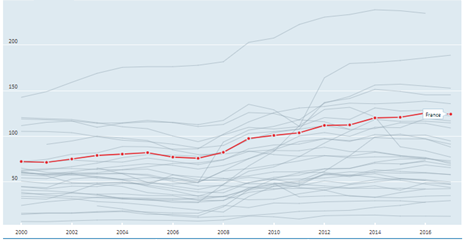
Figure 4.General government debt (Total % of GDP).
General government debt-to-GDP: ratio is the amount of a country's total gross government debt as a percentage of its GDP. It is an indicator of an economy's health and a key factor for the sustainability of government finance. Debt is thus obtained as the sum of the following liability categories (as applicable): currency and deposits; securities other than shares, except financial derivatives; loans; insurance technical reserves; and other accounts payable.
The government debt had been growing in a regular rate. In 2007 it had a huge increase since then it hadn´t stop increasing but in slowly.